Is My Electric Bill Going Up Because of AI? The Charge Is Real — and It Is Not a Line on Your Bill
The bill arrives, the number is worse than last year, and somewhere between the second and third cup of coffee a suspicion forms. So you type the question into Google exactly the way you would say it out loud: is my electric bill going up because of AI. Google finishes the sentence for you before you get to “AI,” which tells you how many other people have been sitting at the same table.
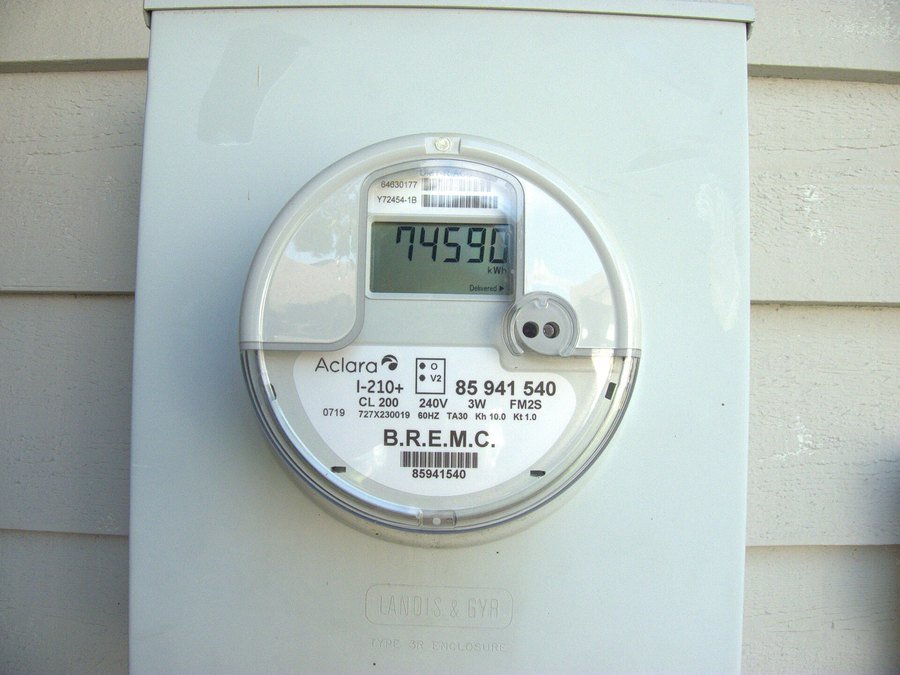
Then you do the sensible thing. You get the paper bill out and you look for the line. Delivery. Supply. Taxes. Some rider with a name like a Scrabble hand. Nowhere on the page does it say data center, and nowhere does it say AI. At which point most people conclude one of two things: that the news was hype, or that the utility is hiding something.
Neither is right. The charge is real, it is large, and it is not hidden — it is folded, three levels down, inside a line that is called something else entirely. Below is where it sits, how big it is, and the four clicks that will show you your own household’s number instead of a national average.
The short answer
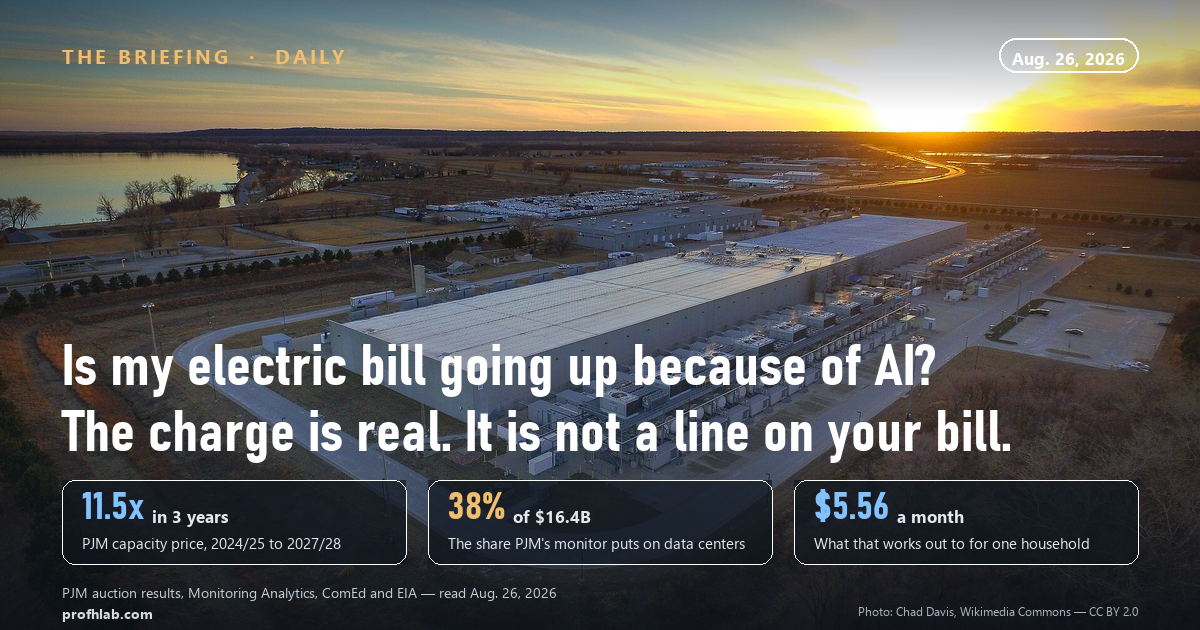
Yes, partly — and the part is measurable. The wholesale price of promising to have electricity available on the hottest afternoon of the year has risen roughly elevenfold in three years across the grid that serves 13 states and Washington, D.C. PJM’s own independent market monitor attributes 38% of the latest auction’s $16.4 billion in charges to data centers.
Worked through one utility’s published rate formula, that lands at roughly $5.56 a month — about $67 a year — on a typical household bill. Not the whole increase. Not nothing.
The number that actually moved
Start with what did not change. Your refrigerator did not get hungrier. The price of the electricity you actually consume moved, but modestly.
What moved violently is a second, less familiar price: the capacity price. Grid operators run an auction every year to buy a promise — the promise that enough power plants will be standing by on the worst demand day of the summer. Power plants bid to make that promise. Everyone on the grid pays for it, whether the plants ever run or not.
PJM, the grid operator for Delaware, Illinois, Indiana, Kentucky, Maryland, Michigan, New Jersey, North Carolina, Ohio, Pennsylvania, Tennessee, Virginia, West Virginia and D.C., publishes the result of that auction. Here is what it published.
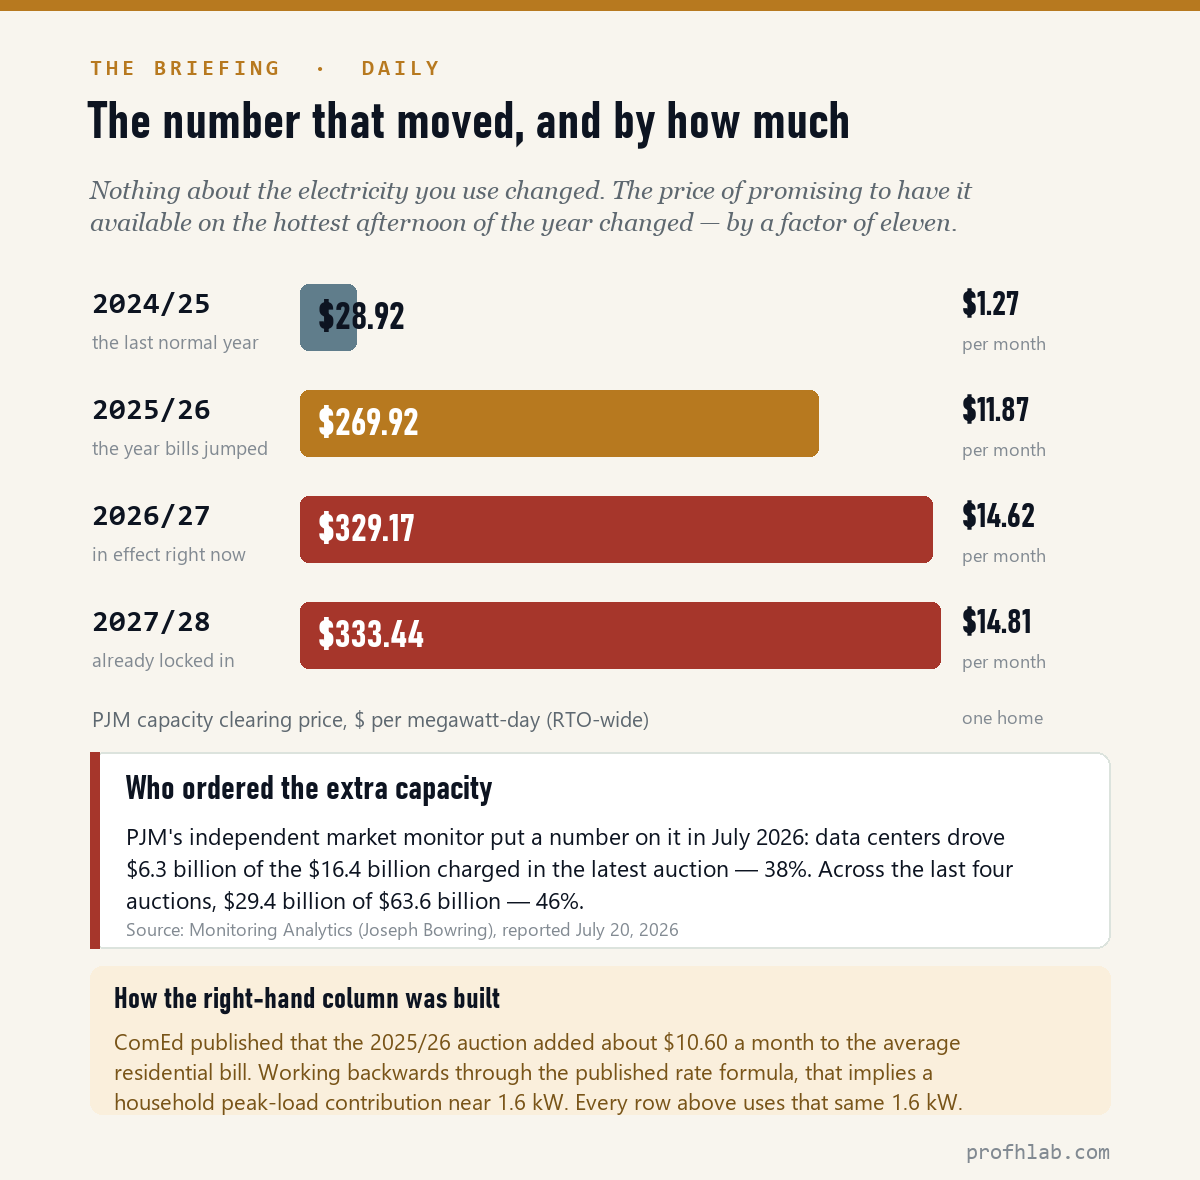
| Delivery year | Clearing price | One household | What it was |
|---|---|---|---|
| 2024/25 | $28.92 | $1.27/mo | The last normal year |
| 2025/26 | $269.92 | $11.87/mo | The year bills jumped |
| 2026/27 | $329.17 | $14.62/mo | In effect right now |
| 2027/28 | $333.44 | $14.81/mo | Already locked in |
Clearing price in dollars per megawatt-day, RTO-wide, from PJM’s auction announcements. Household column derived below.
Eleven and a half times, in three years. There is no consumer product on earth where that would pass without a congressional hearing, and it happened inside a line item most people have never heard of.
Who ordered all that standby power
PJM does not have to guess who caused this, and neither do we. PJM has an independent market monitor — a firm called Monitoring Analytics, whose entire job is to police the market it sits inside — and in July 2026 its president, Joseph Bowring, put a number on it.
Data centers accounted for $6.3 billion of the $16.4 billion charged in the most recent auction. That is 38%. Across the last four auctions: $29.4 billion of $63.6 billion, or 46%.
PJM’s own announcement of the 2027/28 results is blunter than you might expect from a grid operator. Forecast peak load rose about 5,250 MW year over year, and “nearly 5,100 MW of that increase is attributable to data center demand.” Ninety-seven percent of the growth, from one customer class.

Where is the capacity charge on my electric bill?
Here is the honest answer, and it is the reason this question drives people mad: on most residential bills, it is not printed anywhere.
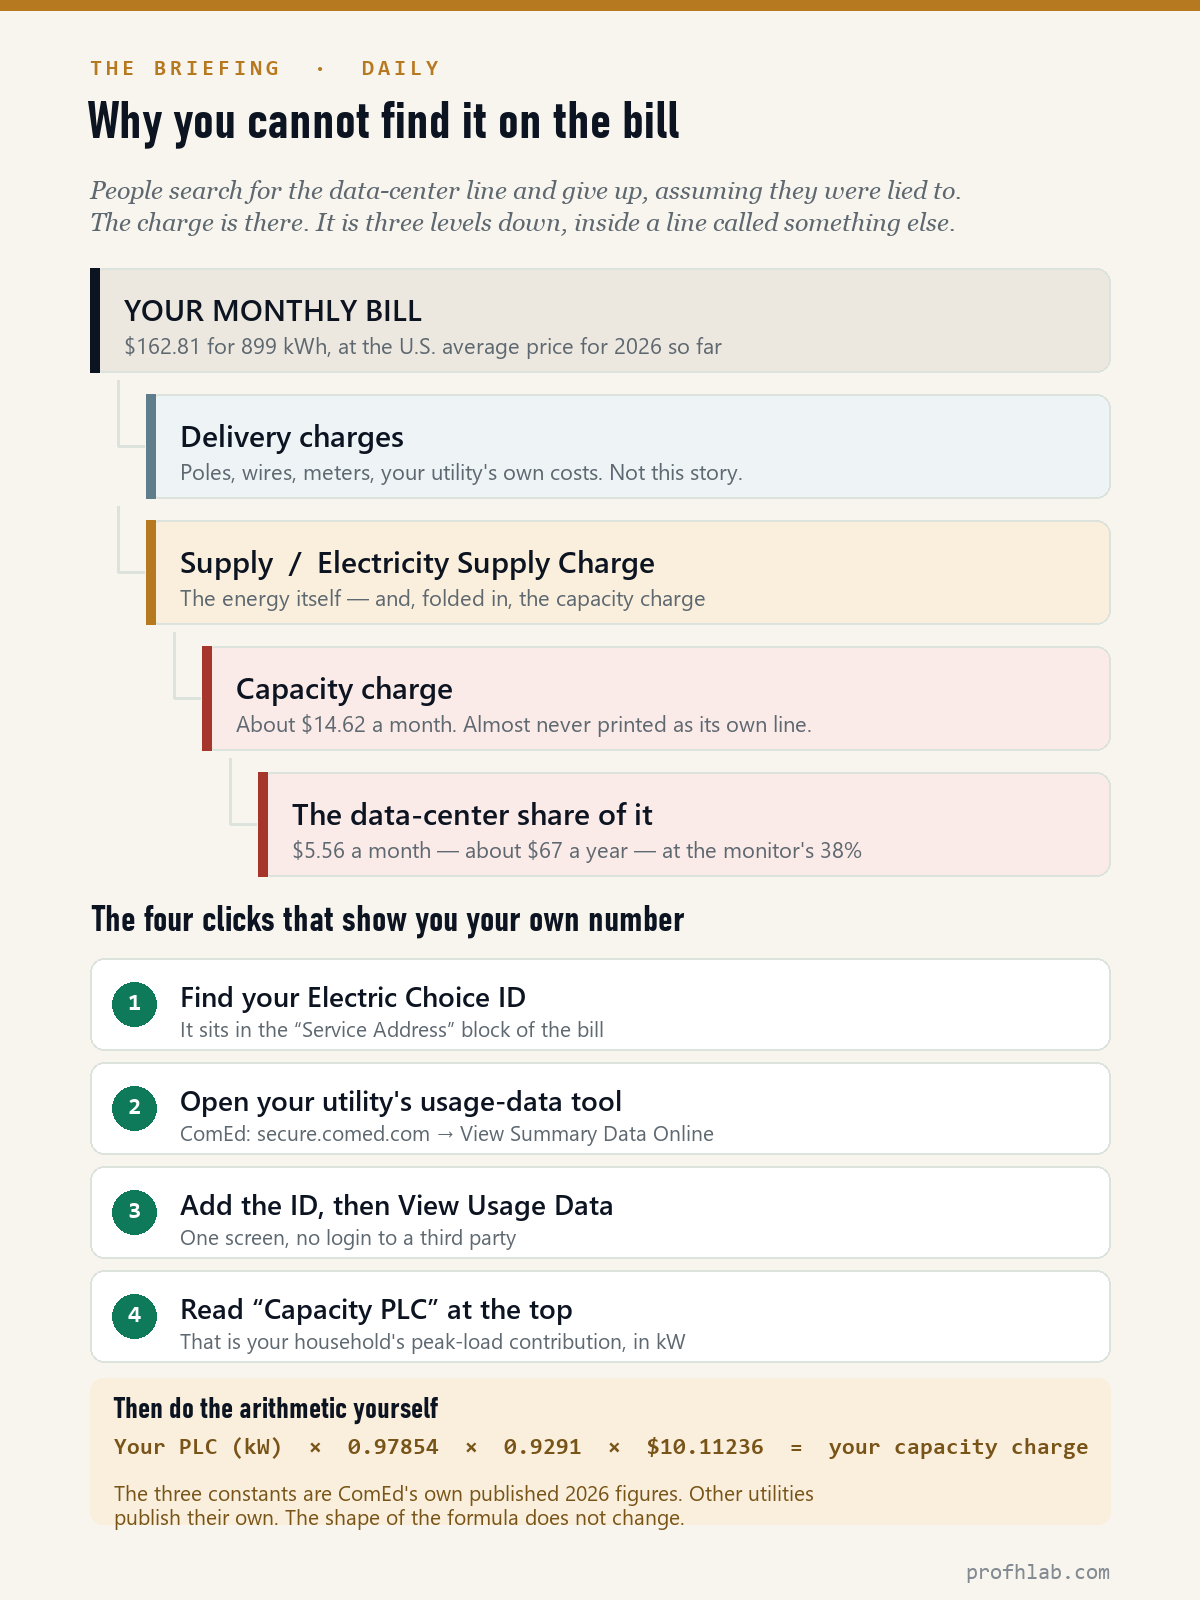
It is inside the supply half of your bill — the part variously labeled Supply, Electricity Supply Charge, Generation, or, if you shop for a supplier, folded into your Price to Compare. Your supplier pays the capacity bill to the grid operator and recovers it from you inside the per-kilowatt-hour rate. One number in, several numbers out.
So the search that fails is “find the data center line.” The search that works is: find the supply charge, then go get the one household-specific number that drives it.
Do the arithmetic on your own bill
Your share of the capacity bill is not based on how much electricity you use over the month. It is based on how much you were drawing during a handful of specific hours last summer — the hours when the whole grid peaked. That figure is called your Peak Load Contribution, or PLC, and it is measured in kilowatts.
It is your number. You can look it up. Illinois’s consumer watchdog, the Citizens Utility Board, published the path for ComEd customers in June 2026:
- Find your Electric Choice ID, in the “Service Address” block of your bill.
- Go to the utility’s usage data tool — for ComEd, secure.comed.com’s Usage Data Tool — and choose View Summary Data Online.
- Click Add, enter the ID, then View Usage Data.
- Read Capacity PLC at the top of the results.
Then multiply. ComEd’s published 2026 formula is your PLC in kilowatts × 0.97854 (a scaling factor) × 0.9291 (the forecast pool requirement) × $10.11236 per kilowatt-month. Other utilities publish their own constants; the shape does not change.
| Your PLC | Capacity charge | Per year | Data-center share |
|---|---|---|---|
| 1.0 kW | $9.19/mo | $110 | $3.49/mo |
| 1.6 kW | $14.62/mo | $175 | $5.56/mo |
| 2.5 kW | $22.98/mo | $276 | $8.73/mo |
| 4.0 kW | $36.78/mo | $441 | $13.97/mo |
Data-center share applies the market monitor’s 38% to the capacity charge only. Big houses and heat pumps push PLC up; apartments and mild summers push it down.
How we know the 1.6 kW is about right
This is the part where most coverage waves a hand, so here is the check, in full.
ComEd told its customers that the 2025/26 auction result would add about $10.60 a month to the average residential bill. That is a published number from the utility itself, not an advocacy estimate. The capacity price went from $28.92 to $269.92 per megawatt-day over that step. Run $10.60 backwards through the same rate formula and the only unknown — the average household’s PLC — comes out at about 1.6 kilowatts.
Now push that 1.6 kW forward a year, through the next price step ($269.92 to $329.17), and the formula predicts an increase of $2.61 a month starting June 2026. ComEd’s guidance to customers for June 2026 was an expected increase of $2 to $3 a month.
A model that is fitted on one published figure and then independently lands inside the range of a second, unrelated published figure is a model you can lean on. Not to the penny — but the order of magnitude is not in doubt.
What this arithmetic does not cover
Capacity is one component of one half of your bill. Transmission build-out, fuel costs, storm hardening, and your utility’s approved delivery-rate increases are all separate, and some of those are also partly demand-driven. So $5.56 is a floor on the AI-related share, not a ceiling.
It also assumes you are inside PJM. If you are on ERCOT in Texas, or a vertically integrated Southeastern utility, there is no capacity auction to point at — the same pressure arrives through different plumbing.
The complication nobody in the news mentions
Here is where the story stops being simple, and it is worth your attention precisely because you will not hear it on the evening broadcast.
In July 2026, Fortune reported on a working paper from the Electric Power Research Institute, by researcher Asa Watten, that used FERC and EIA data from 2015 to 2024 and found the opposite of the headline: for every doubling of data center capacity, average retail electricity prices fell about 3.5%, and up to roughly 6% at the state level.
Both findings can be true, and understanding why is the single most useful thing in this article.
Electricity is priced to recover fixed costs. Spread those fixed costs over more kilowatt-hours and the average price per kilowatt-hour goes down. That is what the 2015–2024 window measured: a decade in which data centers were large, steady, and roughly matched by existing supply. Meanwhile the capacity charge measures something else entirely — the cost of scrambling for headroom that does not exist yet. One is an average being diluted. The other is a scarcity price spiking. They are different meters on the same wall.
Which brings the real risk into focus, and Watten names it: if the grid builds for demand that does not show up, the fixed costs divide among fewer users and the historical pattern reverses. In other words, the worst outcome for your bill is not an AI boom. It is an AI boom that is overbuilt for and then fizzles — and the concrete gets paid for anyway.
What the national numbers say
If you are outside PJM, the federal price series still tells you something. The U.S. Energy Information Administration publishes average retail electricity prices monthly. Through May 2026, the year-to-date residential average is 18.11 cents per kilowatt-hour, against 16.78 cents for the same months of 2025 — a rise of 7.9%.
EIA’s most recent per-customer figure has a U.S. household buying about 899 kWh a month. At that usage, 1.33 cents translates to roughly $11.96 a month more than a year ago, or about $144 over a year. For context, the residential average in 2016 was 12.55 cents; in 2025 it was 17.30. Most of that decade’s increase happened in its last two years.
Watch
Find your PLC and check your rate against the Price to Compare
- Look up your PLC using the four steps above, and run the formula. You will learn whether you are a 1.0 kW household or a 4.0 kW household, and the gap between those is over $300 a year.
- Compare your supply rate to your utility’s Price to Compare. In the retail-choice states — Pennsylvania, Ohio, Illinois, Maryland, New Jersey, D.C. — the utility must publish it. If a third-party supplier is charging you meaningfully more, that gap is yours to close, and it is often larger than the entire data-center share.
- Shave the peak, not the month. Because PLC is set during a handful of hot summer afternoons, pre-cooling the house in the morning and easing off between roughly 3 and 6 p.m. on the hottest days of the year changes next year’s capacity bill in a way that turning off a lamp in January does not.
- Ask about budget billing to level the summer spike, and about your utility’s low-income discount if one applies. ComEd’s launched in 2026; many others exist.
- If the bill is genuinely unaffordable, call LIHEAP. The National Energy Assistance Referral hotline is 1-866-674-6327 (TTY 1-866-367-6228), weekdays 9 a.m. to 7 p.m. Eastern, or email energyassistance@ncat.org. It routes you to your state’s program by ZIP code. It is a federal program and it is free to apply.
- Say something to your state regulator. Twenty-three states have now approved at least one “large load tariff” — rules that make very large users pay their own way — and seven more have one pending. These are decided in public dockets where the utility and the data center are always represented and residential customers usually are not.
Pennsylvania, Oregon and Minnesota already limit the cost shift
- “Can a state actually stop the cost shift?” Some already have. Pennsylvania’s PUC voted 5–0 in April 2026 to adopt a model large-load tariff covering customers above 50 MW individually or 100 MW in aggregate. Oregon created a separate rate class, Schedule 96, under its 2025 POWER Act. Minnesota bars utilities from passing data center costs to other ratepayers at all.
- “Will the 2027/28 price show up on my bill?” Yes, starting June 2027, and it is already fixed at $333.44 — a 1.3% increase over the current year. The steep part of the climb is behind us; the high plateau is not.
- “What should I watch next?” Two things. PJM’s next base residual auction, whose result sets the price for June 2028 onward, and your own state commission’s large-load docket. If your state is in the pending seven, that decision will matter more to your bill than anything a data center company announces.
Data centers or fuel? Splitting the rise on the PJM grid
Is my electric bill going up because of AI?
Partly, and the part is quantifiable. On the PJM grid, which covers 13 states and D.C., the market monitor attributes 38% of the most recent capacity auction’s $16.4 billion in charges to data centers, and 46% across the last four auctions. Worked through one utility’s published rate formula, that comes to roughly $5.56 a month for a typical household. Other cost drivers — fuel, transmission, storm hardening, approved delivery-rate increases — make up the rest of your increase.
Where is the capacity charge on my electric bill?
On most residential bills it is not printed as its own line. It sits inside the supply half of the bill, labeled Supply, Electricity Supply Charge, Generation, or built into your Price to Compare. Only a few rate plans, such as ComEd’s Hourly Pricing, break it out separately.
How much do data centers raise my electricity bill?
It depends on your grid and your own peak usage. Inside PJM, applying the market monitor’s 38% share to the 2026/27 capacity charge gives roughly $3.49 a month for a low-usage household, $5.56 for a typical one, and about $14 for a large one. That is the capacity component only and should be treated as a floor.
Can I opt out of paying for data centers?
No. Capacity costs are grid-wide and flow through every supply rate, including fixed-price contracts. What you can influence is your own peak-load contribution, which is set during a handful of hot summer afternoons, and which supplier you buy from.
Are electricity prices actually going up nationally?
Yes. EIA’s residential average for January through May 2026 is 18.11 cents per kilowatt-hour, against 16.78 cents for the same months of 2025 — up 7.9%. At the U.S. average household purchase of about 899 kWh a month, that is roughly $11.96 a month more than a year ago.
Do data centers ever lower electricity prices?
Over a long enough window, they have. An EPRI working paper using FERC and EIA data from 2015 to 2024 found that each doubling of data center capacity was associated with a 3.5% decrease in average retail prices, because fixed costs spread across more consumption. The risk is the reverse case: if the grid builds capacity for demand that never arrives, those fixed costs divide among fewer users and prices rise.
Sources
- PJM Interconnection, 2027/2028 Base Residual Auction results, Dec. 17, 2025 — $333.44/MW-day, $16.4 billion, and the 5,100 MW data center figure.
- PJM Interconnection, 2026/2027 Base Residual Auction results, July 22, 2025 — $329.17/MW-day, prior year $269.92.
- Monitoring Analytics (Joseph Bowring), reported by Utility Dive, July 20, 2026 — $6.3B of $16.4B (38%); $29.4B of $63.6B over four auctions (46%).
- ComEd, Why is your electric bill going up? — the $10.60 per month figure and the June 2026 $2–$3 guidance.
- Citizens Utility Board (Illinois), How to calculate the customer capacity charge, June 23, 2026 — the PLC lookup steps and the 0.97854 / 0.9291 / $10.11236 constants.
- U.S. Energy Information Administration, Electric Power Monthly, Table 5.3 — average retail price by sector through May 2026.
- U.S. Energy Information Administration, FAQ: How much electricity does an American home use? — 899 kWh per month.
- Asa Watten (EPRI working paper), reported by Fortune, July 26, 2026 — the 3.5% decrease finding and the overbuild risk.
- Pennsylvania PUC large load tariff framework, April 30, 2026; Oregon PUC Schedule 96; Edison Electric Institute large-load tariff tracker (23 states approved, 7 pending as of May 2026).
- LIHEAP Clearinghouse, National Energy Assistance Referral — 1-866-674-6327.
The AI costs you do see: subscriptions and whether Plus is worth it
- What AI really costs you per month (once you claim what you already have)
- Is ChatGPT Plus still worth it?
- How to use ChatGPT: a beginner’s guide for people over 50
Written by Prof. H, who thinks a number you can reproduce beats a number you have to trust. Every price above was read on PJM’s, EIA’s, ComEd’s and the Citizens Utility Board’s own pages on August 26, 2026, and the household conversion is shown in full so you can check it against your own bill. Rates change and vary by utility and state; confirm with your provider before acting. General information, not financial advice.
Prof.’s H Newsletter
One short email a month, with the numbers in it
What actually moved in AI hiring, AI prices, and the scams aimed at older Americans. Counted here, dated, and linked to the source. One email a month, and your address goes nowhere else.