Why Is Hurricane Season So Quiet This Year? El Niño, Explained
At 8:00 a.m. Eastern on Monday, August 17, the National Hurricane Center in Miami published one of the shortest bulletins it writes. Under the heading for the North Atlantic, the Caribbean and the Gulf, the forecaster on duty wrote a single sentence: Tropical cyclone formation is not expected during the next 7 days.
That sentence landed three weeks before September 10 — the date on which, across the entire historical record, more Atlantic storms have been spinning than on any other day of the year.
Meanwhile, about 3,000 miles to the west, the same agency was issuing its twentieth advisory on Tropical Storm Lala: 50 mph winds, drifting west across the Central Pacific.
One agency, one morning, two oceans behaving in opposite directions. That contrast is the story, and it has a name.
The short version. A strengthening El Niño is holding the Atlantic down and pushing the Pacific up. NOAA now puts a 69% chance on this becoming the strongest El Niño since at least 1950. But a quiet season is not a safe season — the worst Atlantic hurricane in modern American memory struck during one.
What has actually happened so far
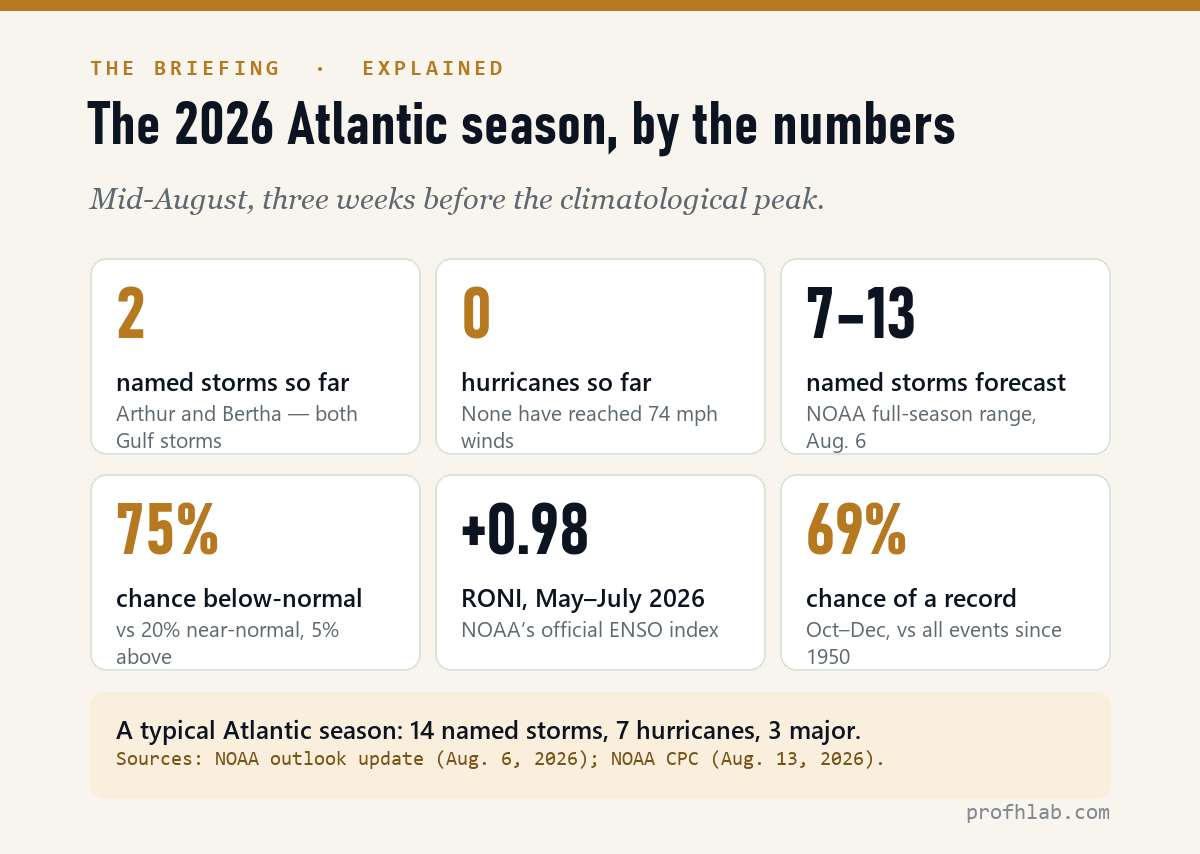
By the middle of August, the 2026 Atlantic season has produced two named storms and no hurricanes at all. Tropical Storm Arthur formed in the Gulf off the Texas coast in mid-June; Tropical Storm Bertha formed in the Gulf south of the Florida panhandle and came ashore in St. Bernard Parish, Louisiana.
Here is where that sits against NOAA’s updated seasonal outlook, issued August 6, and against a normal year.
| Atlantic basin | 2026, so far | NOAA forecast, full season | Typical season |
|---|---|---|---|
| Named storms (39+ mph) | 2 | 7–13 | 14 |
| Hurricanes (74+ mph) | 0 | 2–6 | 7 |
| Major hurricanes (111+ mph) | 0 | 0–2 | 3 |
NOAA’s forecasters put a 75% chance on the season finishing below normal, a 20% chance on near-normal, and just a 5% chance on above-normal.
Why is hurricane season so quiet this year?
The dominant reason is a single word that does most of the work in tropical meteorology: shear.
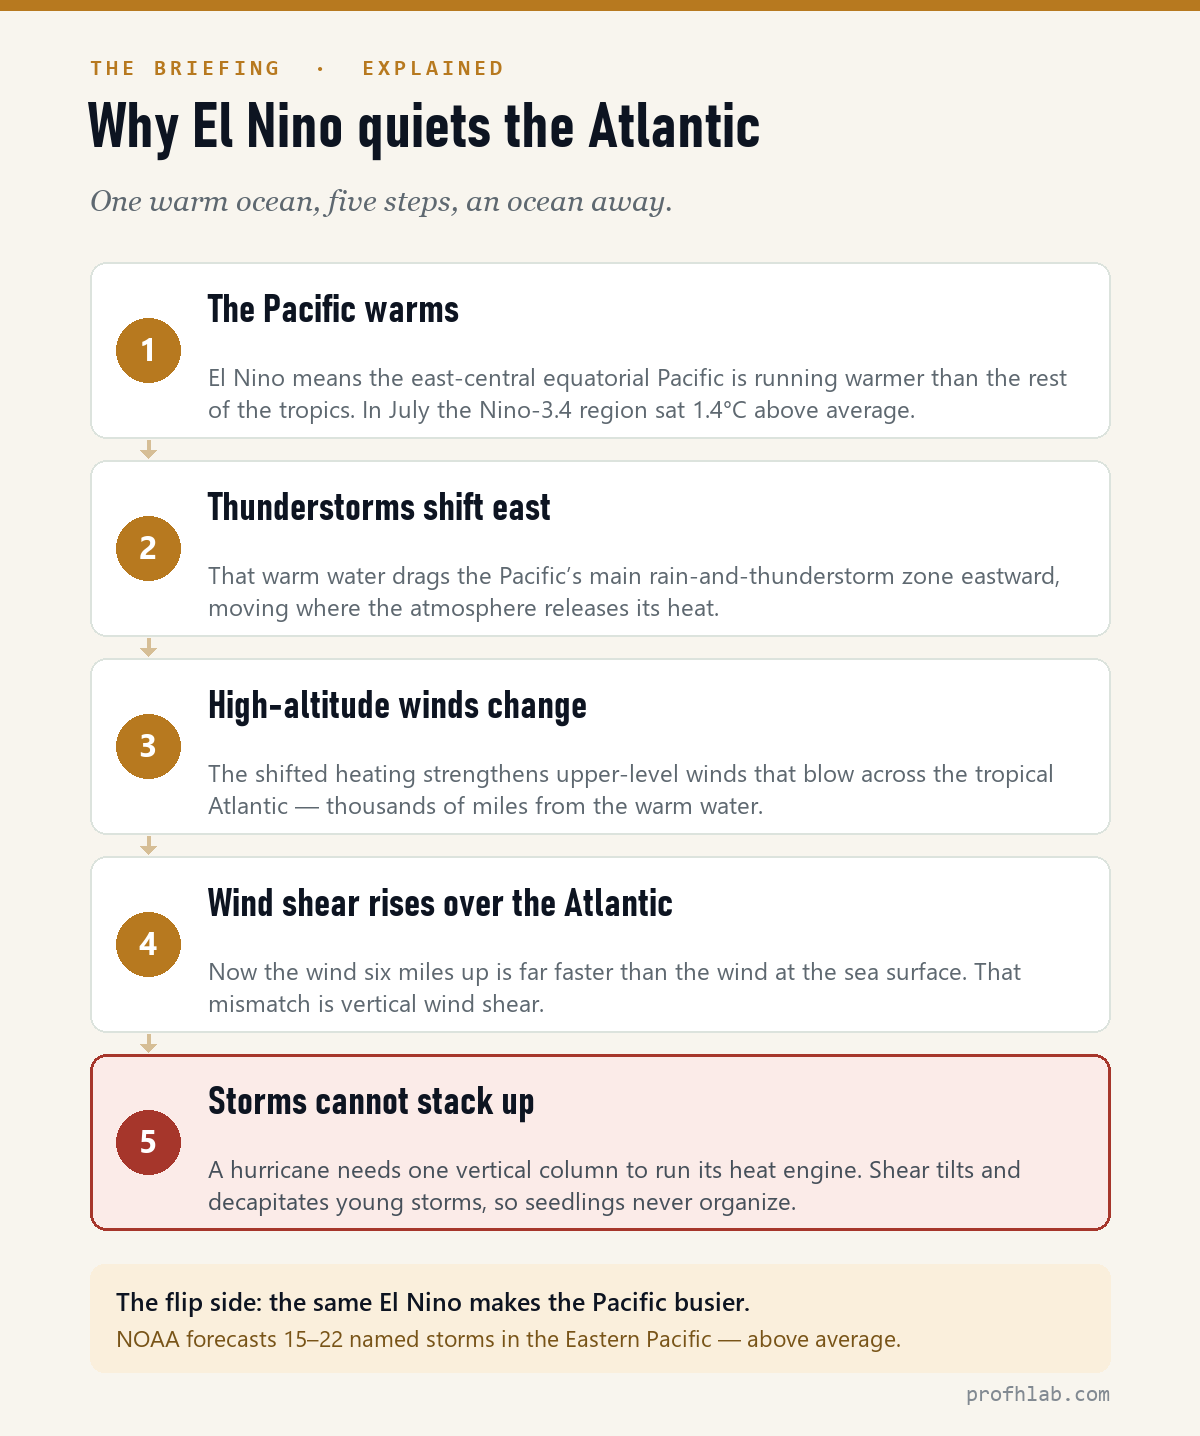
Picture a hurricane as a chimney. Warm, wet air rises through a tall vertical column and dumps its heat high in the atmosphere, and that release is the engine that spins the storm faster. The chimney only draws if it stands up straight.
Vertical wind shear is a crosswind at roof height. When the wind six miles up races along much faster than the wind at the sea surface, the top of a developing storm gets pushed off the bottom: the column tilts, the heat escapes sideways instead of stacking, and the engine never starts. Shear does not so much destroy hurricanes as prevent them from being born. El Niño manufactures that crosswind — from an ocean away.
Two lesser factors are also in play, according to NOAA: Atlantic Ocean temperatures near average, and a neutral west African monsoon — neither one helping storms along, neither one the main event.
NOAA’s lead hurricane season forecaster, Matt Rosencrans, put the hierarchy plainly in the August outlook: “When El Niño emerges, it usually becomes the dominant factor in total hurricane season activity, and this El Niño continues to get stronger every month.”
Is this a “Super El Niño”? What the official numbers actually say
You have probably seen the phrase. It is worth knowing that “Super El Niño” is not an official NOAA category — it is informal shorthand. The Climate Prediction Center’s own language for what it expects this fall and winter is “very strong.”
You may also have seen numbers that do not agree with each other. There are two reasons for that, and almost nobody explains either one.
First: El Niño is measured in more than one place. In July, the tropical Pacific was running above average by different amounts depending on which box you looked at:
- Niño-3.4 (central Pacific, the region used for the headline index): +1.4°C
- Niño-3 (east-central): +1.7°C
- Niño-1+2 (a small box off Peru and Ecuador): +2.9°C
When an article tells you this El Niño is “already past +2.0,” it is usually quoting that last box — the one closest to South America and the least relevant to what happens over Kansas in January.
Second, and bigger: NOAA changed its official ruler in February 2026. The index of record is no longer the ONI (Oceanic Niño Index) that everyone learned. It is now RONI, the Relative Oceanic Niño Index.
The difference is simple to state. The ONI compares the Niño-3.4 region to a fixed 30-year average. RONI takes the same Niño-3.4 readings and then subtracts the average anomaly across the entire tropical belt, from 20°S to 20°N, before rescaling the result to match ONI’s overall spread.
Why bother? Because as the tropical oceans warm as a whole, a fixed historical average makes every year look a little more El Niño-ish than the atmosphere actually behaves. In NOAA’s own words, the older index “struggles to keep pace with anomalous changes in tropical sea surface temperature.” What drives the wind shear over the Atlantic is not how warm the Pacific is in absolute terms — it is how much warmer that patch is than everywhere else in the tropics. RONI measures that contrast directly.
The two rulers give noticeably different readings on the same ocean:
| Three-month season | ONI (former index) | RONI (official since Feb. 2026) |
|---|---|---|
| Feb–Apr 2026 | +0.11 | −0.44 |
| Mar–May 2026 | +0.46 | −0.04 |
| Apr–Jun 2026 | +0.95 | +0.49 |
| May–Jul 2026 | +1.39 | +0.98 |
Same storm, different ruler. NOAA is explicit that the thresholds and definitions have not moved — only the measurement improved. Its own worked example: the 2023–24 El Niño reads +1.5°C on RONI versus +2.1°C on ONI. The event did not get weaker. RONI simply removed the part of the temperature spike that came from a generally warmer ocean rather than from the El Niño cycle itself.
Historical events are being reclassified on the new index too, so a 1950 event and a 2026 event can be compared on equal terms.
Which brings us to the number in the headlines. On August 13, the Climate Prediction Center said El Niño is strengthening, with a greater than 90% chance of a very strong event during the Northern Hemisphere fall and winter of 2026–27. And for October through December, it put a 69% chance on a historic event — one that “would exceed the strength of previous El Niño events dating back to 1950,” meaning a three-month RONI value of +2.5°C or higher.
Read that carefully, because the distinction matters: the record is a forecast, not a measurement. Today’s official reading is +0.98 — a moderate El Niño that is climbing steeply. The record-breaking part is what NOAA’s models expect by late autumn. CPC adds its own caveat: with an event of that magnitude, the chances of El Niño-like impacts are larger, “but they are not guaranteed.”
Does a quiet season mean I am safe?
No. This is the part of the story that gets lost, and it is the part that actually matters if you live near the coast.
In 1992, the Atlantic produced just four hurricanes all season, under El Niño’s influence. One of those four was Hurricane Andrew, which came ashore south of Miami on August 24 as a Category 5 — 165 mph sustained winds, according to the NOAA Best Track Committee reanalysis that upgraded the storm a decade later. It killed 65 people and was, at roughly $27 billion in 1992 dollars, the costliest natural disaster in U.S. history at the time. A season can produce almost nothing and still produce a catastrophe.
Three things worth holding onto:
- A seasonal outlook is not a landfall forecast. NOAA says so directly. Where a storm goes is decided by weather patterns that are only predictable about a week out.
- The season is far from over. By NHC climatology, an average year sees six more named storms after September 10 — four of them hurricanes, two of them major.
- Both 2026 storms formed in the Gulf, close to shore. Storms that spin up near land give you less warning than the ones that cross the whole Atlantic. Arthur brought record rainfall to parts of Louisiana and spawned tornadoes without ever becoming a hurricane.
On that last point, NOAA’s National Weather Service Director Ken Graham was blunt in the August outlook: “Inland rainfall is a major cause of damage from tropical storms and hurricanes, as Arthur demonstrated. That’s why it’s important to prepare for every storm that’s projected to impact your area, even if it never reaches hurricane strength.”
Is El Niño good or bad?
It depends entirely on where you live. El Niño does not reduce the total amount of tropical weather on Earth so much as move it.
| Where | What El Niño tends to do | 2026 status |
|---|---|---|
| Atlantic / Gulf / Caribbean | Fewer and weaker storms — more shear | 2 named storms; 75% odds of a below-normal season |
| Eastern Pacific | More storms — warmer water, friendlier winds | 7 named storms already; 15–22 forecast, above average |
| Central Pacific (incl. Hawaii) | More storms | Above normal expected; 5–13 forecast. Tropical Storm Lala active August 17 |
The Gulf Coast is getting a reprieve this year that Hawaii and Mexico’s Pacific coast are not. There is no free lunch in the atmosphere — only a redistribution.
El Niño winters in the U.S. also tend to run wetter across the southern tier and drier and milder across the north. Those are tendencies, not a forecast — CPC is careful to say impacts are never guaranteed even in a strong event. For an actual winter outlook, watch for CPC’s seasonal outlooks this fall.
What to watch, and when
- September 10 — the climatological peak of the Atlantic season. If the basin is still empty a week after this, the below-normal forecast is close to locked in.
- September 10 — coincidentally, the date of CPC’s next ENSO Diagnostic Discussion, which will update the RONI reading and the record-event odds.
- October–December — the window in which NOAA expects the event to peak, and the window that 69% figure refers to.
- November 30 — the Atlantic season officially ends.
For anything operational — watches, warnings, whether to board up — the source is the National Hurricane Center at hurricanes.gov, not a seasonal outlook and not this article. Seasonal forecasts tell you what kind of year to expect; they cannot tell you about your street.
Meteorologists explain why this El Niño matters
A word of caution about storm season and your wallet. Two patterns show up every hurricane season: relief and charity fraud after a landfall (fake funds, cloned charity names, urgent calls), and fear marketing — generators, “El Niño-proof” home products, and prep kits sold on a countdown clock.
The rule that survives both: nobody legitimate needs your money in the next ten minutes. For the longer version, including the safe-word kit and the first-60-minutes plan, see AI scams targeting seniors.
How machines predict an ocean. A seasonal hurricane outlook is a physics simulation running on real measurements — satellites overhead, a buoy array strung along the equator, and models that carry the ocean and atmosphere forward in time. That is the same problem, in a different costume, as teaching a robot what happens next in the physical world. If that interests you, start with Physical AI, explained.
Two named storms by mid-August: does that mean the U.S. is safe?
Why is hurricane season so quiet this year?
A strengthening El Niño is increasing vertical wind shear over the tropical Atlantic, which prevents developing storms from organizing. Two smaller factors — near-average Atlantic sea surface temperatures and a neutral west African monsoon — are also failing to help storms along. As of mid-August 2026 the basin has produced two named storms and no hurricanes, and NOAA puts a 75% chance on the season finishing below normal.
How does El Niño affect hurricanes?
Warmer-than-usual water in the central and eastern Pacific shifts the region’s main thunderstorm zone eastward. That changes high-altitude wind patterns thousands of miles away, strengthening upper-level winds over the tropical Atlantic. The result is vertical wind shear: the wind high up moves much faster than the wind at the surface, which tilts and decapitates young storms before they can build the vertical column a hurricane needs.
Is El Niño good or bad for hurricanes?
Both, depending on the ocean. El Niño suppresses Atlantic hurricane activity, which is good news for the U.S. East and Gulf coasts. It simultaneously enhances activity in the Eastern and Central Pacific — NOAA forecasts 15–22 named storms in the Eastern Pacific for 2026, above average, and an above-normal Central Pacific season. Hawaii and Mexico’s Pacific coast carry more risk in an El Niño year, not less.
Is 2026 a “Super El Niño”?
“Super El Niño” is informal shorthand, not an official NOAA category; the Climate Prediction Center’s term is “very strong.” As of the May–July 2026 season the official RONI reading was +0.98°C, which is a moderate El Niño. CPC forecasts more than a 90% chance of a very strong event by fall and winter, and a 69% chance that October–December sets a record exceeding every El Niño back to 1950. The record is a forecast, not a current measurement.
Does a quiet season mean no hurricane will hit the U.S.?
No. A seasonal outlook predicts overall activity, not landfalls, which are only predictable about a week ahead. Hurricane Andrew struck south of Miami as a Category 5 in 1992, a quiet season with just four hurricanes. NHC climatology also shows an average year produces six more named storms after the September 10 peak, four of them hurricanes. One storm on the wrong track is all it takes.
When is the peak of hurricane season?
September 10 is the climatological peak of the Atlantic hurricane season — the calendar date with the most recorded tropical storm and hurricane activity. Most activity falls between mid-August and mid-October, driven by the warmest ocean temperatures of the year, relaxing upper-level winds, and less Saharan dust. The season officially runs June 1 to November 30.
Sources
- NOAA — “NOAA maintains prediction for below-normal Atlantic hurricane season,” seasonal outlook update (August 6, 2026)
- NOAA Climate Prediction Center — ENSO Diagnostic Discussion (August 13, 2026), including the 69% historic-event probability and July Niño region values
- NOAA Climate Prediction Center — RONI and ONI index tables (values through May–July 2026)
- NOAA National Weather Service Climate Services — “Relative Oceanic Niño Index (RONI): What’s Changing and Why It Matters,” information circular (adopted February 2026)
- NOAA National Hurricane Center — Tropical Weather Outlook, 8:00 a.m. EDT August 17, 2026; Tropical Storm Lala advisory 20 (August 17, 2026); tropical cyclone climatology
- NOAA AOML — How El Niño impacts the Atlantic hurricane season (mechanism)
- Hurricane Andrew — NOAA/NHC Best Track Committee reanalysis (2002), which upgraded the 1992 landfall to Category 5 at 165 mph; National Park Service historical summary
- YouTube subscriber and view counts verified August 17, 2026
Three more plain explainers: Kilauea, Social Security, robots
- Kilauea’s lava fountains, explained — why one volcano erupts in numbered episodes, and where to watch it free.
- Your 2027 Social Security raise, and what Medicare takes back — the per-$1,000 math, done honestly.
- Physical AI, explained — why a chatbot knows the cup falls but a robot doesn’t.
About the author
Prof. H is a professor of AI and robotics, a former Samsung researcher, and the author of dozens of textbooks on AI and automation. He writes hands-on, no-hype guides. More about the author →
Prof.’s H Newsletter
One short email a month, with the numbers in it
What actually moved in AI hiring, AI prices, and the scams aimed at older Americans. Counted here, dated, and linked to the source. One email a month, and your address goes nowhere else.